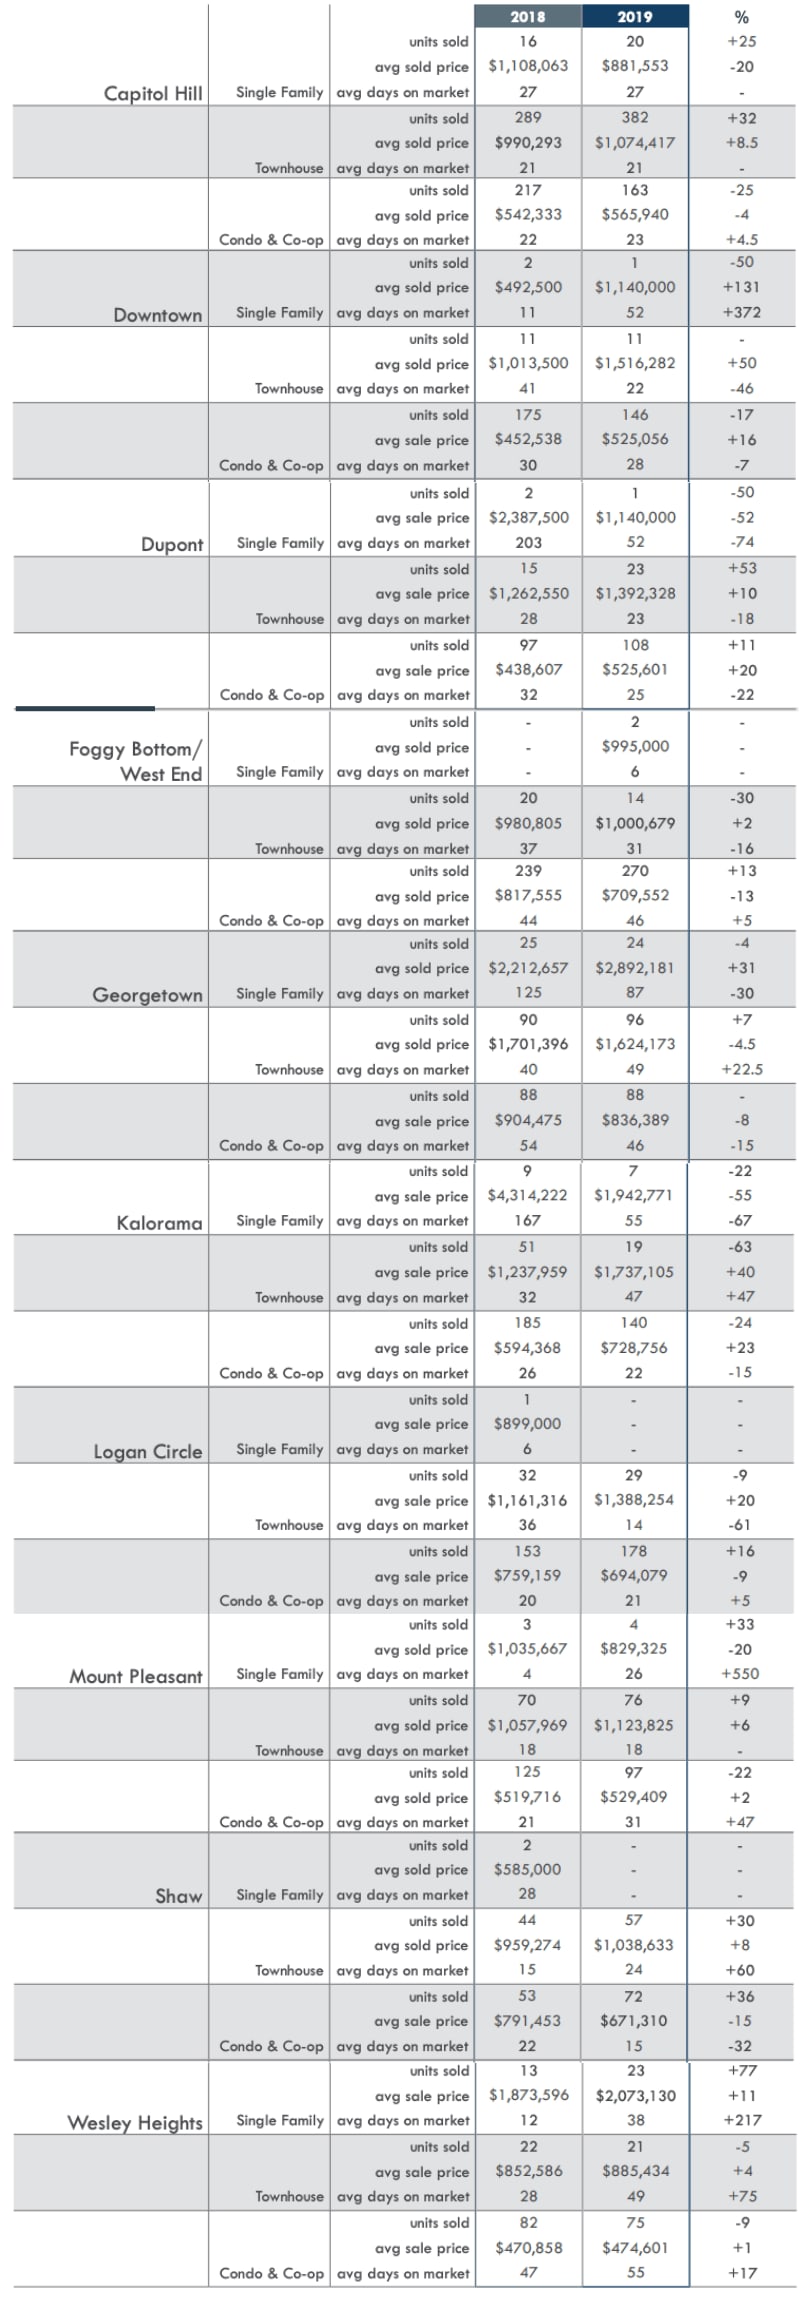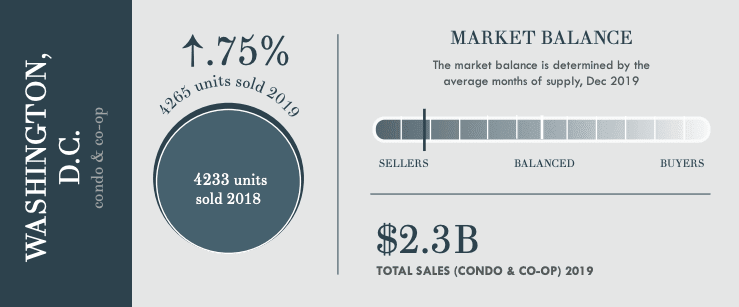

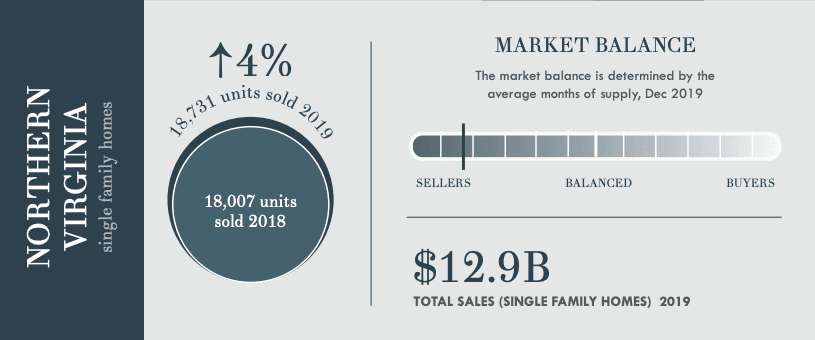
The real estate market results from 2019 show that the Greater DC area saw impressive growth, with Northern Virginia seeing the strongest of the region for average home sales price increase and unit sales. Demand outweighed inventory driving a very competitive market, and we anticipate that continuing into 2020.
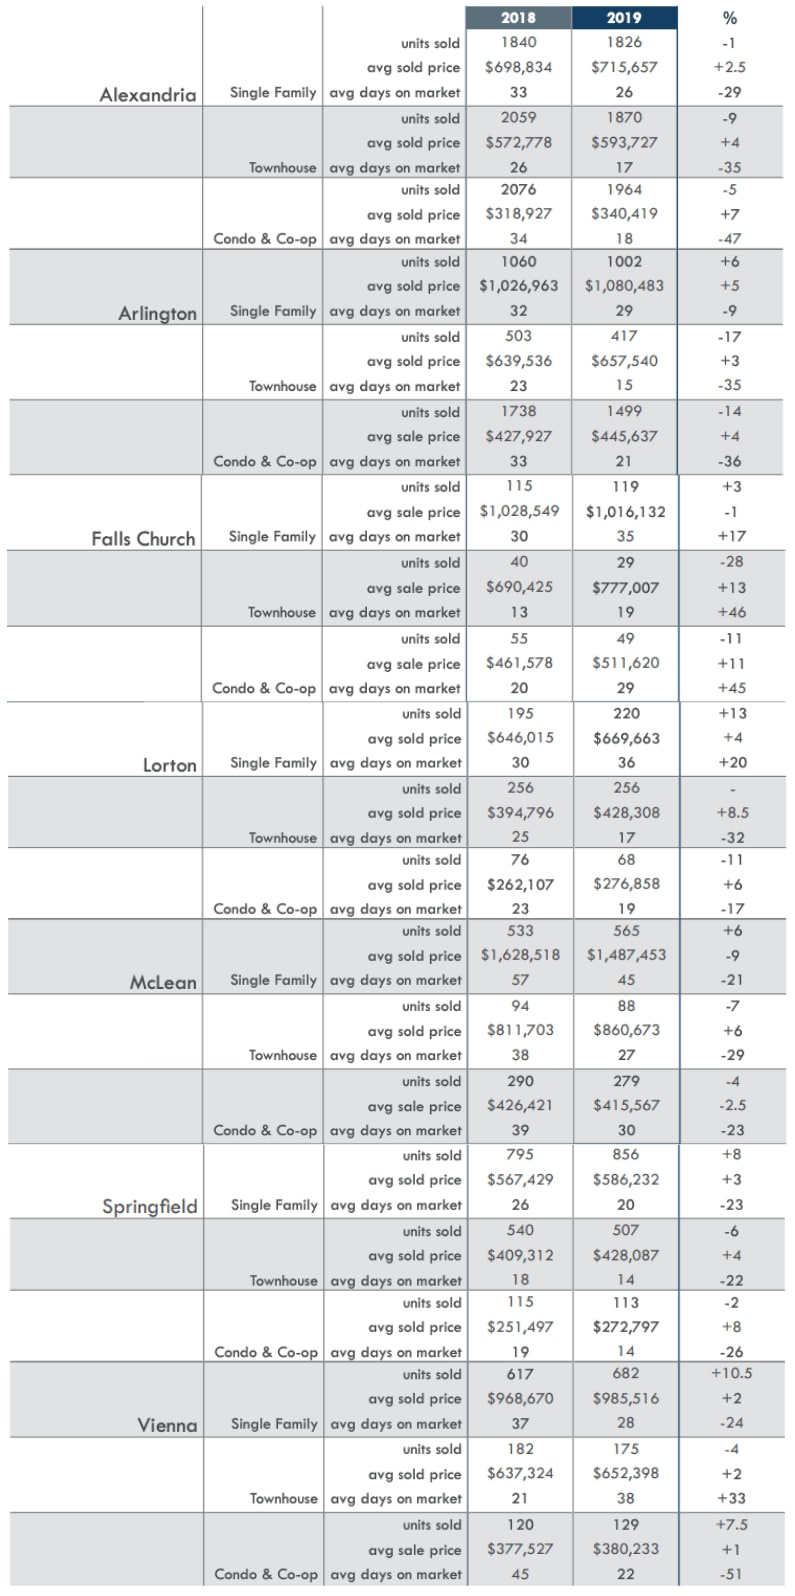
Most cities in Northern Virginia saw incredible growth and increasing home prices throughout 2019. Considered two of the most competitive markets in the country, Alexandria and Arlington continued to see significant home price increases while the number of unit sales did not see the same increase as inventory remained tight. However, Fairfax County saw a 4% home price increase and unit sales were up 3% with average days on the market down 17%.
As we move into 2020, the Greater DC real estate market is estimated to continue the positive growth the region has seen over the past several years. Inventory levels are estimated to improve slightly with interest rates remaining low, and median home prices expected to rise 4 – 4.5% on an annual basis.
As always, please let us know if you have any questions. If you are thinking about buying or selling your home this year, please reach out and we will be happy to walk you through our process.
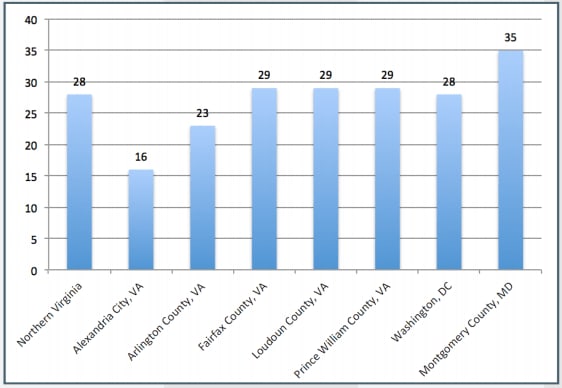
Q4 2019 Days On Market
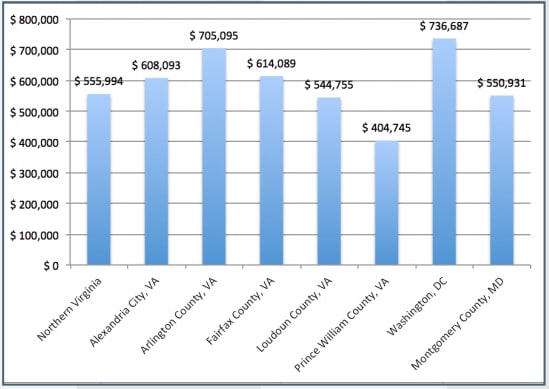
Q4 2019 Avg. Sales Price
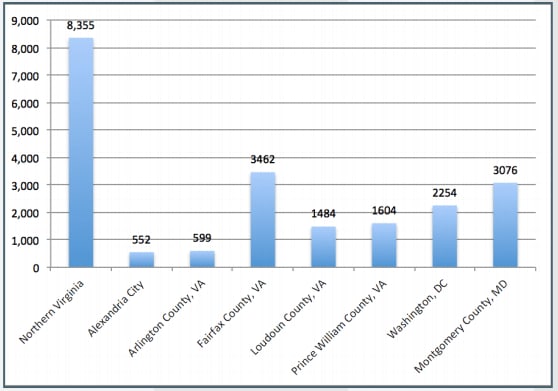
Q4 2019 Sales
Northern Virginia
Washington, DC